制作适用于 LaTeX 的专业 Matplotlib 图像
1 🔠 字体
在学术论文与技术报告中,图像字体与 LaTeX 正文不一致是一个极其常见、却经常被忽视的问题。 这种不一致虽然不影响实验结果,却会显著降低整体排版的专业度,尤其在 IEEE、ACM 等对排版要求严格的会议与期刊中。 这部分将系统性地说明:
- 如何从根本上解决字体样式与字号不匹配的问题;
- 一套可复用、工程化的最佳实践流程。
核心原则
让 LaTeX 接管字体渲染
要想 100% 保证 Matplotlib 图像中的字体与 LaTeX 正文完全一致,唯一可靠的方法是:
使用 LaTeX 作为最终的字体渲染引擎,而不是依赖 Matplotlib 的内建字体系统。
在实践中,这一原则可以从两个层面落实:
- 在 Matplotlib 里使用 LaTeX 字体渲染;
- 将尽可能多的文字推迟到 LaTeX 文档中,通过 overpic 添加。
这两者并不冲突,而是相互补充。
1.1 在 Matplotlib 里使用 LaTeX 字体渲染
📦 安装 TeX Live
要想在 Matplotlib 中使用 LaTeX 引擎,首先要安装完整的 LaTeX 发行版。
- macOS:
brew install texlive - Debian / Ubuntu:
apt install texlive-full - Windows:请参考 官方指南
安装完成后,请确认以下命令可正常执行:pdflatex --version.
若该命令不可用,说明 LaTeX 尚未加入系统 PATH。
🚀 启用 LaTeX 字体渲染
在 Matplotlib 中,只需通过 rcParams 启用 usetex 即可:
import matplotlib.pyplot as plt

plt.rcParams.update({
    "text.usetex": True,
    "font.family": "Computer Modern",
})
此时,所有文本元素(标题、坐标轴、刻度、图例)都会由 LaTeX 渲染,其字体风格将与正文完全一致。
1.2. 用 LaTeX 的 overpic 管理图中文字
❓ 为什么不推荐在 Matplotlib 中写太多文字?
即使启用了 LaTeX 渲染,在 Matplotlib 中硬编码文字仍然存在局限:
- 不便于交叉引用(图号、公式号、文献)
- 后期修改成本高
- 排版语义与正文割裂
因此,一个更稳健的原则是: 除非是坐标轴、刻度等“图形语义”,其余文字尽量交由 LaTeX 处理。
📝 使用 overpic 添加批注
将普通的 figure:
\begin{figure}
  \centering
  \includegraphics[width=1.0\linewidth]{example.pdf}
\end{figure}
替换为:
\begin{figure}
  \centering
  \begin{overpic}[width=1.0\linewidth]{example.pdf}
    \put(X, Y){Example text}
  \end{overpic}
\end{figure}
其中:
-
\put(X, Y){...}用于在图像指定位置放置文字; -
花括号内可以是 任意 LaTeX 内容:
- 公式 \ref /, \cref, \cite
- 数学符号或宏命令
这使得图像真正成为 LaTeX 文档的一部分,而不是一个“外来对象”。
1.3 字体大小
字体大小问题的本质不是“字号”,而是“尺寸”。 许多人在调整字体大小时,习惯直接修改:
- font.size
- axes.labelsize
- legend.fontsize
但这往往治标不治本。 字体看起来太小,往往不是字号设得不够大,而是图像本身设得过大。
Matplotlib 中的字体大小是以 物理尺寸(英寸) 为基准计算的,而 LaTeX 在排版时会对图像进行缩放。 如果图像在生成时尺寸过大,那么即使字体是 10pt,插入文档后也会被整体缩小,从而显得“字体偏小”。
✔️ 正确的控制顺序
字体大小控制必须遵循以下顺序:
- 先确定图像在 LaTeX 中的最终显示宽度;
- 在 Matplotlib 中使用相同的物理宽度设置figure 宽度;
- 再设置与正文一致的字体大小。
以 IEEE 双栏论文为例的标准做法,在 IEEE 双栏排版中单栏宽度 ≈ 3.5 英寸。
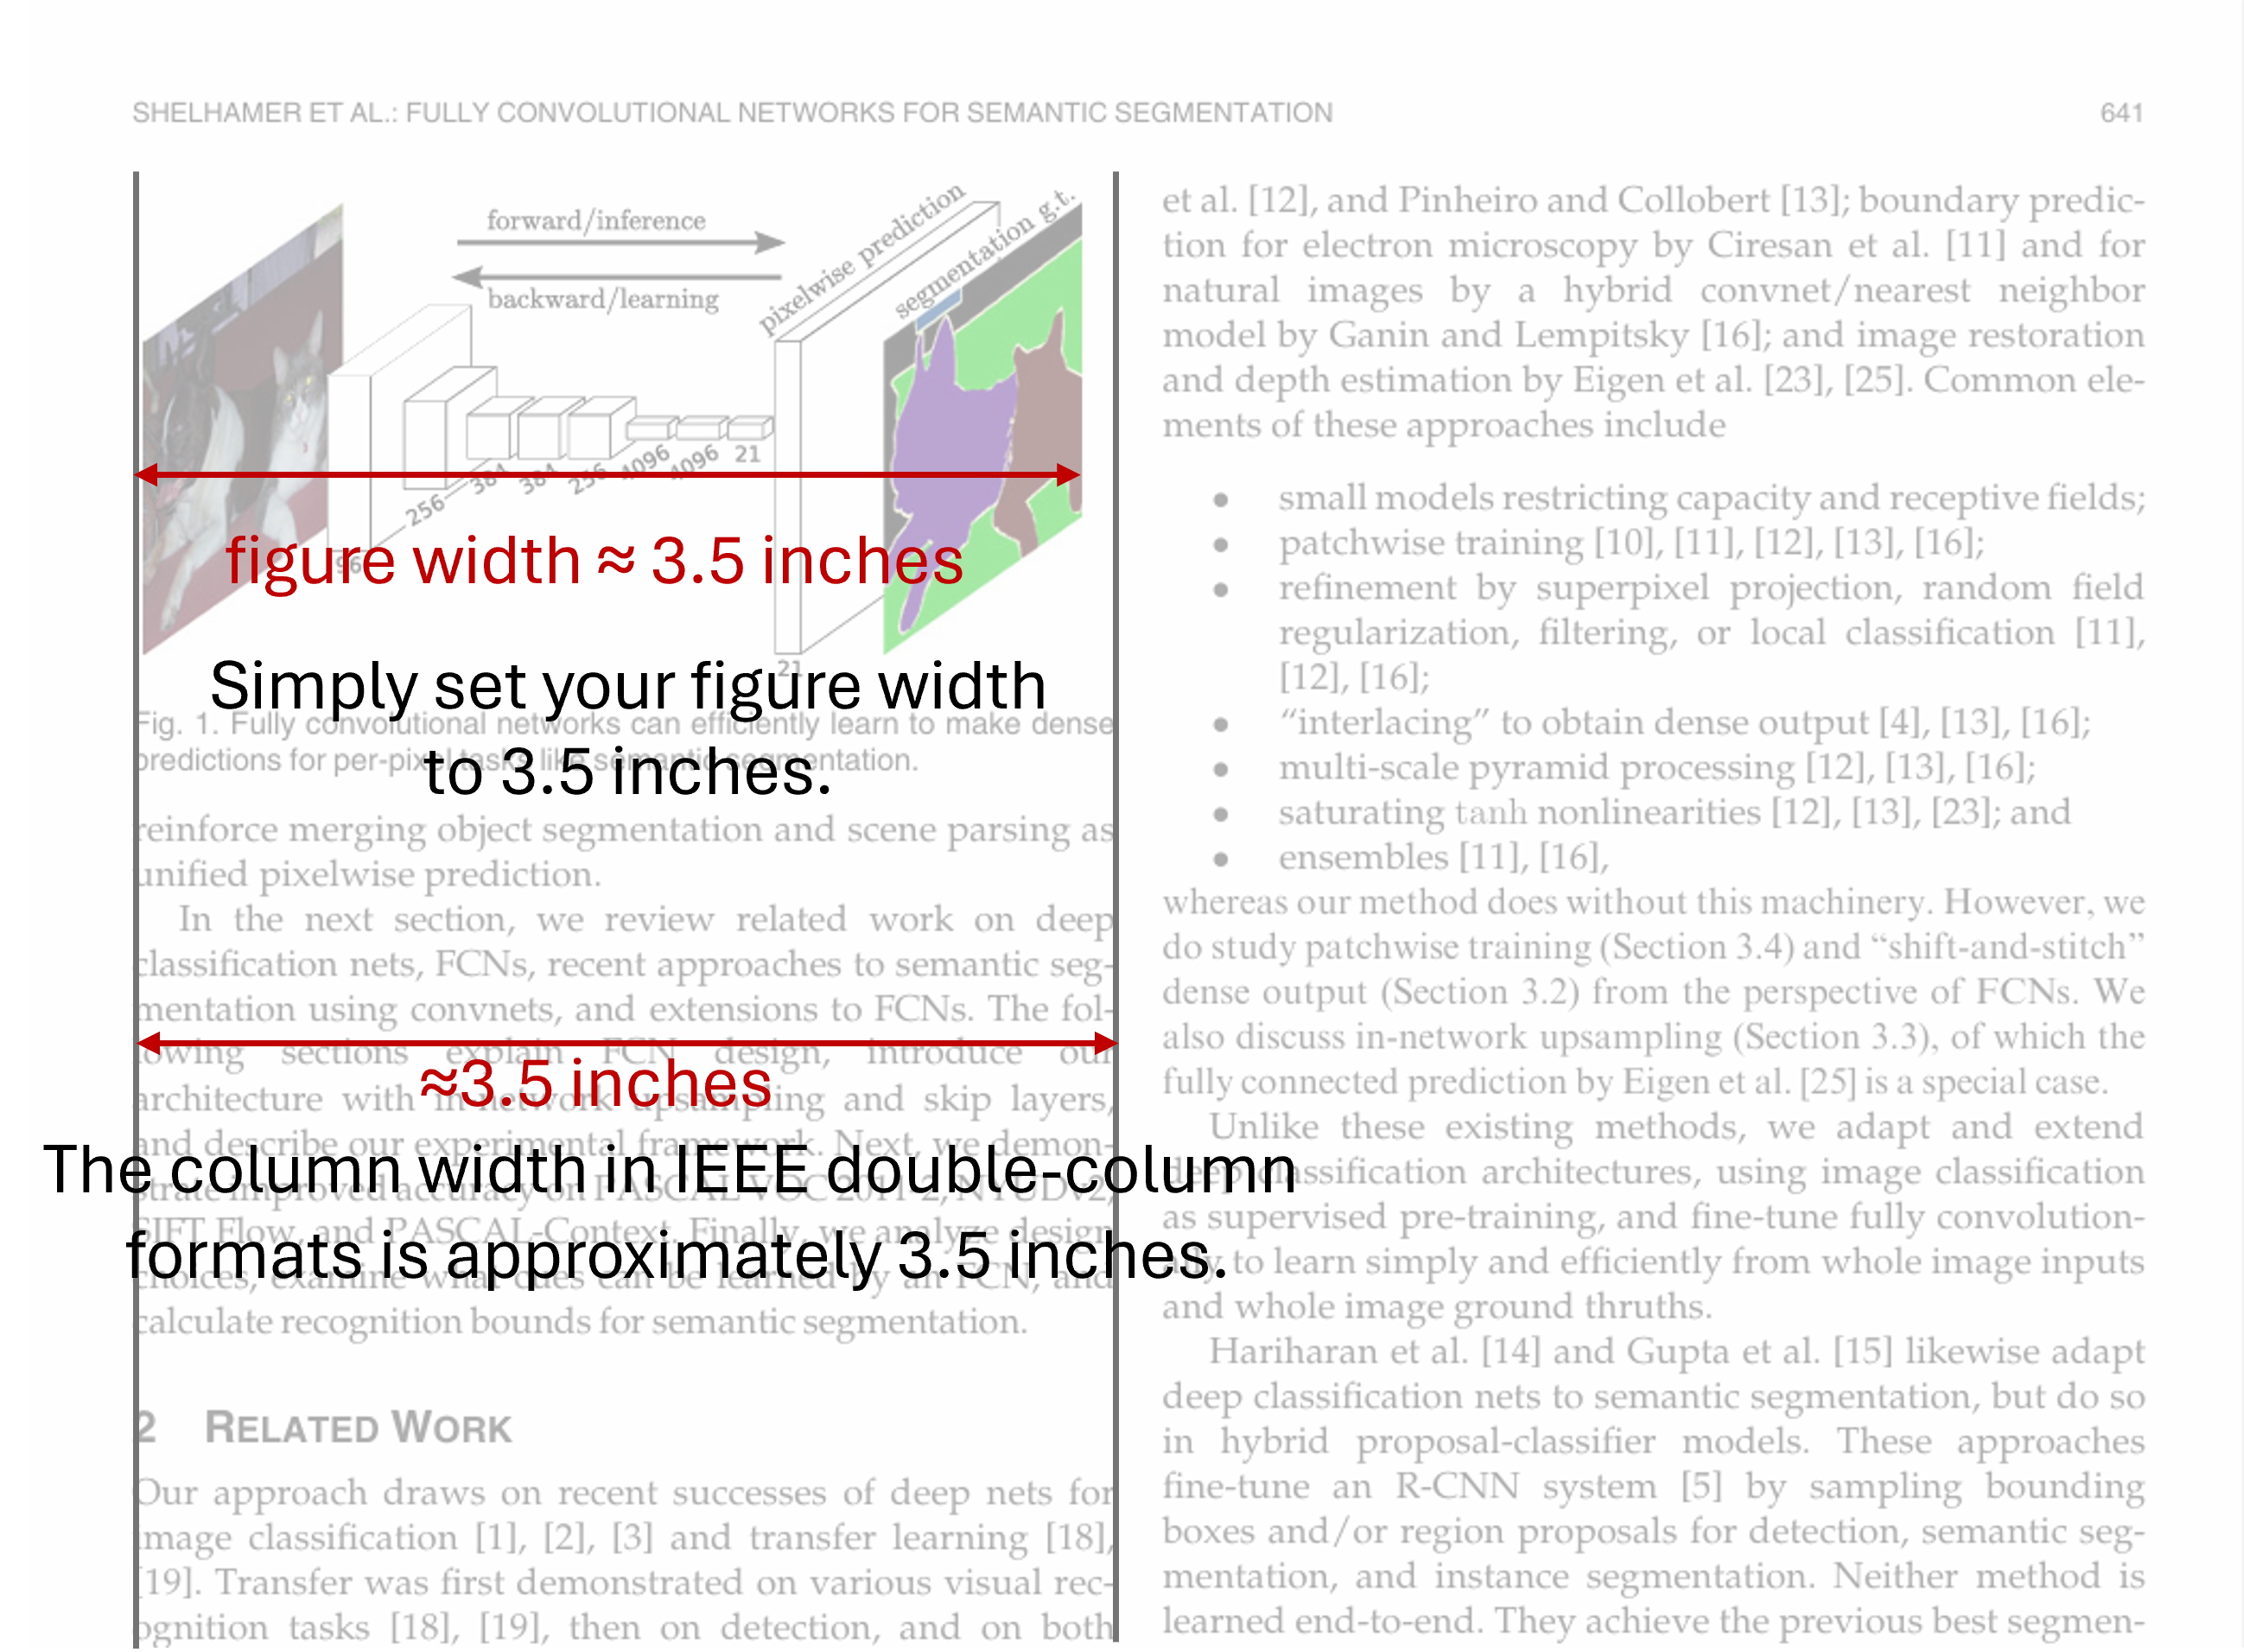
IEEE 双栏格式中,单栏列宽约为 3.5 英寸。
对于单栏图像,应直接在 Matplotlib 中设置宽度为 3.5 英寸:
fig = plt.figure(figsize=(3.5, HEIGHT))
在设置好宽度之后,设置与正文一致的字体大小
import matplotlib as mpl

mpl.rcParams.update({
    "font.size": 10,
    "axes.labelsize": 10,
    "axes.titlesize": 10,
    "figure.titlesize": 10,
    "legend.fontsize": 9,
    "xtick.labelsize": 9,
    "ytick.labelsize": 9,
})
至此,不需要任何“微调技巧”, 图像中的文字会自然地与 LaTeX 正文对齐。
1.3 总结:一套可复用的工作流
可以将全文的方法总结为以下三条准则:
- 字体渲染统一交给 LaTeX
- 图中文字能放在 LaTeX 就不要放在 Matplotlib
- 图像尺寸必须等于最终显示尺寸
遵循这三点,你将获得:
- 字体样式 100% 一致
- 字号自然匹配,无需反复试错
- 图像与正文在排版语义上的高度统一
这不仅是“调好看”,而是符合学术排版工程化思维的解决方案。
2. 最佳工程实践
2.1. 将绘图代码与数据纳入论文项目,避免手工流程
建议将所有绘图相关内容统一放入论文项目的 figures/ 子目录中:
figures/:绘图代码(Matplotlib / Seaborn / Plotly 等)figures/data/:绘图所需的数据(如曲线点坐标、统计结果等)
这种组织方式可以实现论文素材的 self-contained:
- 论文所需的所有图像、代码和数据都位于同一项目中;
- 图像由代码自动生成,而不是手动拷贝;
- 避免“在 A 处画图、复制到 B 处”的不可追踪流程。
核心原则:
能自动化的,就不要手动操作。
下面是一个典型的论文项目目录结构示例:
├── cvpr.cls
├── cvpr.sty
├── cvpr.tex
├── eg.bib
└── figures
    ├── data
    │   └── pr-curve.npy
    ├── figures.ipynb
    ├── figures.pptx
    ├── network-arch.pdf
    └── pr-curve-crop.pdf
2.2. 使用 Notebook 统一生成论文图像
推荐使用 Jupyter Notebook 进行绘图,并尽量将论文所需的图集中在一个或少量 .ipynb 文件中完成。
这样做的好处包括:
- 全局配置(配色、字体大小、LaTeX 字体渲染等)只需设置一次;
- 全论文图像风格保持一致;
- 便于可视化调试和后期修改。
在这一流程中,Notebook 扮演的是图像生成管线的角色,而不是临时实验脚本。
2.3. 绘图后自动裁剪 PDF 白边(pdfcrop)
Matplotlib 导出的 PDF 图像通常在四周包含多余的白边(margin)。在论文排版中,这些白边会影响版面紧凑性和对齐效果。
可以使用 TeX Live 提供的 pdfcrop 工具,对生成的 PDF 进行自动裁剪:
pdfcrop --margins "0 0 0 0" path/to/figure.pdf
为了避免手工处理,建议将该步骤直接集成到绘图代码中,实现从绘图到最终可用图像的全自动流水线:
import os
import matplotlib.pyplot as plt

fig, ax = plt.subplots(1, 1, figsize=(3.5, 2))

ax.plot()  # 绘图逻辑
# ...

fn = "figure.pdf"
plt.savefig(fn)

# 自动裁剪白边(生成 figure-crop.pdf)
os.system(f"pdfcrop --margins '0 0 0 0' {fn}")
这样生成的 *-crop.pdf 文件可以直接用于 LaTeX 文档,无需额外调整。
注意:使用
pdfcrop的前提是系统中已安装 TeX Live,并确保pdfcrop命令已正确加入PATH,可在命令行中直接调用。
可参考:TeX Live 安装。
3. 精细化控制 legend
📊 Matplotlib Legend 的精细控制
Legend 是 Matplotlib 坐标轴中的一个重要组成部分,用于标识和区分图中的不同元素。
Legend Location: loc
使用 legend(loc=) 指定图例的位置。
该参数既可以是精确坐标,也可以是字符串形式的位置描述,例如
For example: ax.legend(loc=(0, 0.5)) or ax.legend("upper left").
fig, axes = plt.subplots(1, 3, figsize=(8, 3))
for i, ax in enumerate(axes):
    ax.set_ylim(-2, 1.1)
    for y in ys:
        axes[i].plot(x, y)
    axes[i].legend([f"i={i}" for i in range(5)], loc=(i/3, i/3))
plt.tight_layout()

Legend at different locations.
字体大小:fontsize
使用 legend(fontsize=) 指定图例字体大小。
import matplotlib.pyplot as plt

fig, axes = plt.subplots(1, 3, figsize=(8, 3))

for i, ax in enumerate(axes):
    ax.set_ylim(-2, 1.1)
    for y in ys:
        axes[i].plot(x, y)
    axes[i].legend([f"i={i}" for i in range(5)], loc=(0, 0), fontsize=8+i*3)
plt.tight_layout()

Legend with various font sizes.
列数:ncol
import matplotlib.pyplot as plt

fig, axes = plt.subplots(1, 3, figsize=(8, 3))
for i, ax in enumerate(axes):
    ax.set_ylim(-2, 1.1)
    for y in ys:
        axes[i].plot(x, y)
    axes[i].legend([f"i={i}" for i in range(5)], loc=(0, 0), ncol=i+1)
plt.tight_layout()

Legends of different columns.
行间距:labelspacing
fig, axes = plt.subplots(1, 3, figsize=(8, 3))
for i, ax in enumerate(axes):
    ax.set_ylim(-2, 1.1)
    for y in ys:
        axes[i].plot(x, y)
    axes[i].legend([f"i={i}" for i in range(5)], loc=(0, 0), ncol=2, labelspacing=2*i)
plt.tight_layout()

Adjust the spacing between columns.
列间距:columnspacing
fig, axes = plt.subplots(1, 3, figsize=(8, 3))
for i, ax in enumerate(axes):
    ax.set_ylim(-2, 1.1)
    for y in ys:
        axes[i].plot(x, y)
    axes[i].legend([f"i={i}" for i in range(5)], loc=(0, 0), ncol=2, columnspacing=2*i)
plt.tight_layout()

Adjust the spacing between columns.
Handle 长度: handlelength
fig, axes = plt.subplots(1, 3, figsize=(8, 3))
for i, ax in enumerate(axes):
    ax.set_ylim(-2, 1.1)
    for y in ys:
        axes[i].plot(x, y)
    axes[i].legend([f"i={i}" for i in range(5)], loc=(0, 0), ncol=2, handlelength=i+1)
plt.tight_layout()

Adjust handle length.
Handle 与文本之间的间距:handletextpad
fig, axes = plt.subplots(1, 3, figsize=(8, 3))
for i, ax in enumerate(axes):
    ax.set_ylim(-2, 1.1)
    for y in ys:
        axes[i].plot(x, y)
    axes[i].legend([f"i={i}" for i in range(5)], loc=(0, 0), ncol=2, handletextpad=i)
plt.tight_layout()

Space between handle and text.